Introduction
JMX, Java management Extensions are thoroughly used within Tomcat. The technology allows for the live viewing of the running JVM for profiling purposes. Further, with correct writing of management beans it is possible to reconfigure Sakai on the fly.
The current usefulness of JMX is perhaps for viewing of resource depletion and concurrency issues such as thread deadlocking.
See also: Dashboard article
Recipe
Enabling
For an insecure local test server in a well defended lab, to view live information from a test Sakai server, you may enable an open port locally via the following extra options in your start up script (see attachments).
-Dcom.sun.management.jmxremote.port=1099
-Dcom.sun.management.jmxremote.authenticate=false
-Dcom.sun.management.jmxremote.ssl=false
See http://java.sun.com/j2se/1.5.0/docs/guide/management/faq.html for common problems and solutions when configuring remote management. In particular,
- If the server has a firewall, you will need to open access to port 1099 and possibly also port 2737.
- If the server's /etc/hosts file is not configured to return the correct IP address for the server's hostname (as revealed by hostname -i), you may need to correct this.
Jconsole
To activate Jconsole {$JAVA_HOME}/bin/jconsole
Jconsole Walkthru
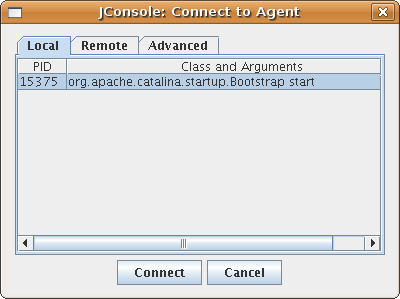
Login either through a process or via remote localhost port 1099
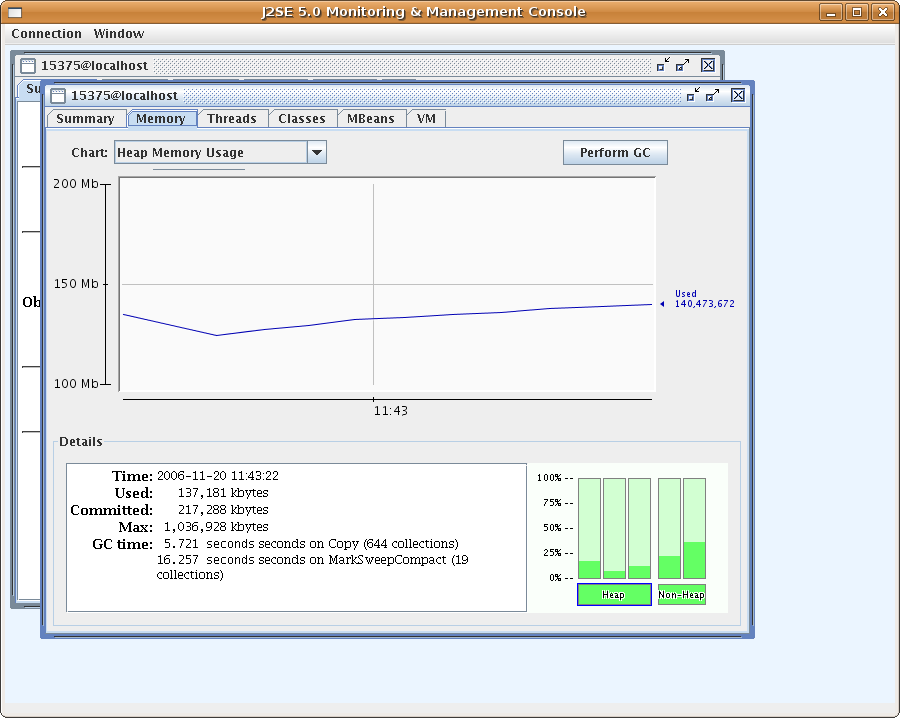
Look at the live summary information and then view the JVM working live
See which threads exist and their details.
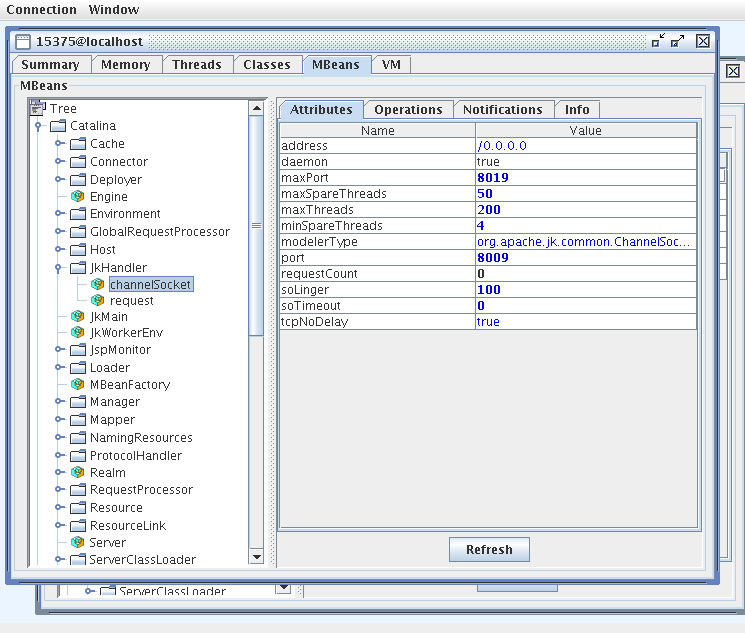
Finally look at all the Mbeans
MC4J
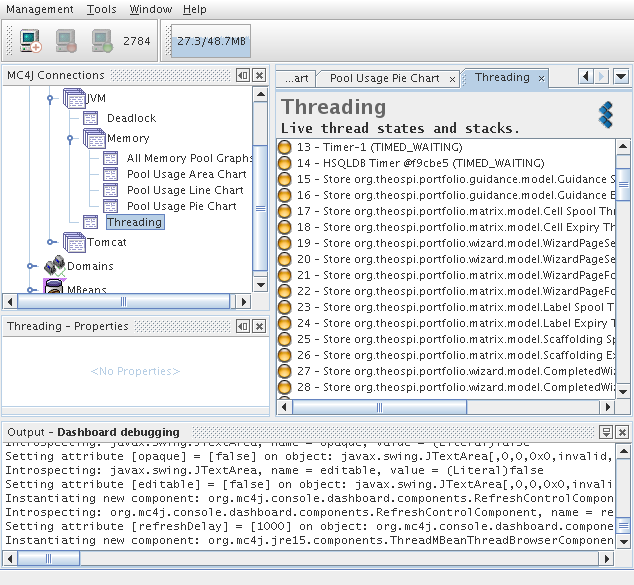
An open source product that has enhanced functionality when compared to Jconsole is MC4J.
The tool even has a nice deadlocking interface


