Live JVM profiling
Introduction
JMX, Java management Extensions are thoroughly used within Tomcat. The technology allows for the live viewing of the running JVM for profiling purposes. Further, with correct writing of management beans it is possible to reconfigure Sakai on the fly.
The current usefulness of JMX is perhaps for viewing of resource depletion and concurrency issues such as thread deadlocking.
See also:
Jconsole improvements and extra options in 1.6
Dashboard article
Remote JVM profiling via SSH tunnels
Recipe
Enabling
For an insecure local test server in a well defended lab, to view live information from a test Sakai server, you may enable an open port locally via the following extra options in your start up script (see attachments).
-Dcom.sun.management.jmxremote.port=1099
-Dcom.sun.management.jmxremote.authenticate=false
-Dcom.sun.management.jmxremote.ssl=false
See http://java.sun.com/j2se/1.5.0/docs/guide/management/faq.html for common problems and solutions when configuring remote management. In particular,
- If the server has a firewall, you will need to open access to port 1099 and the port range from 1099 (1024?) to 65535, as JConsole will make another incoming connection to the server on an unknown high-numbered port.
- Another solution to the firewall is to install a class to make the second port predictable, and open SSH tunnels. See Remote JVM profiling via SSH tunnels.
- If the server's /etc/hosts file is not configured to return the correct IP address for the server's hostname (as revealed by hostname -i), you may need to correct this.
Warning: Always remember to backup configuration files before changing
IPtables is used with the Redhat distribution. If you enable jmx for port 1099 you will find that an RMIregistry sits there by default and gives a second port number out for Jconsole. To enable the range of ports from 1099 to 65xxx then the following rule may be added to /ect/sysconf/iptables
-A INPUT -s <your_host> -p tcp -m tcp --dport 1099: -j ACCEPT
Where <your_host> is the name of the host that is running jconsole.
If you're adding a rule from the shell temporarily, you may need to insert it at the top of the chain, e.g.
iptables -I input_ext -s <your_host> -p tcp -m tcp --dport 1099: -j ACCEPT
Jconsole
To activate Jconsole {$JAVA_HOME}/bin/jconsole
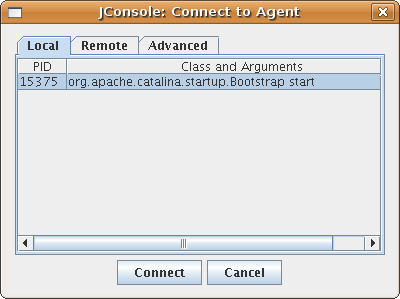
Jconsole Walkthru
Login either through a process or via remote localhost port 1099
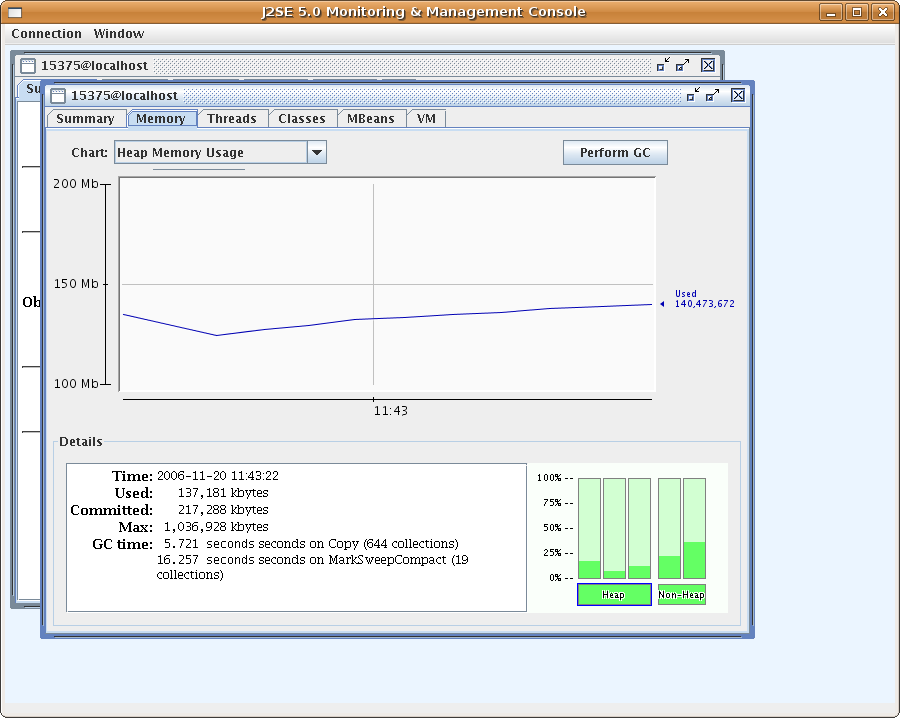
Look at the live summary information and then view the JVM working live
See which threads exist and their details.
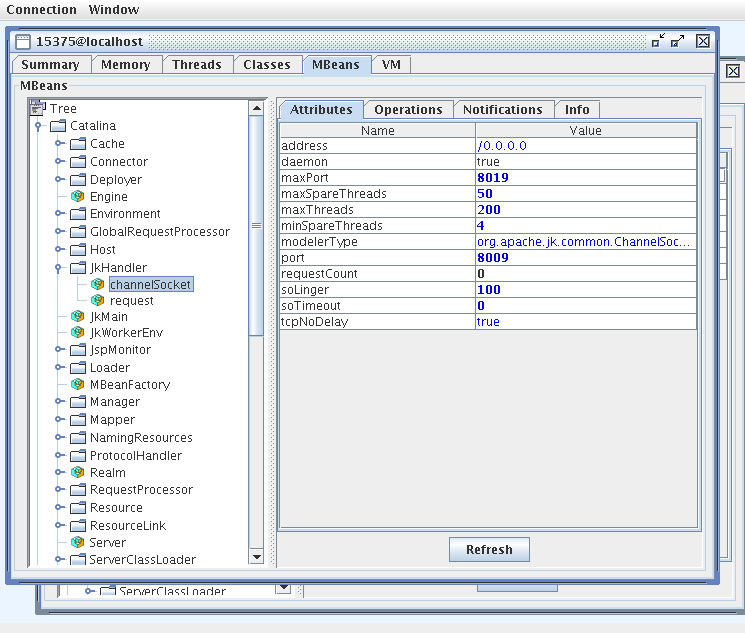
Finally look at all the Mbeans
MC4J
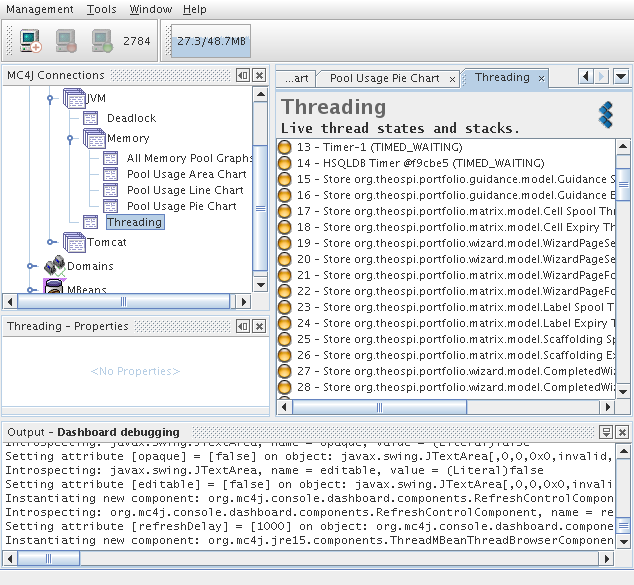
An open source product that has enhanced functionality when compared to Jconsole is MC4J.
The tool even has a nice deadlocking interface
The Command Line
Sakai runs on a JVM and a Tomcat server which contain much management information. The management information has potential to be highly useful for long term profiling or regular system administration. Once the administrator enables remote viewing via a few JAVA_OPTS values it is possible to directly query the information from the command line via an Open Source project:
http://crawler.archive.org/cmdline-jmxclient/index.html
To search for all managed information locally on port 3333:
java -jar cmdline-jmxclient-0.10.3.jar - localhost:3333
Note: the - sign states that no user name or password are required.
The returned listing mentions around 1215 managed beans with potentially relevant information.
To zoom in on one managed bean:
java -jar cmdline-jmxclient-0.10.3.jar - localhost:3333 "java.lang:name=CMS Perm Gen,type=MemoryPool"
to search for Permanent space usage:
java -jar cmdline-jmxclient-0.10.3.jar - localhost:3333 "java.lang:name=CMS Perm Gen,type=MemoryPool" PeakUsage
EXAMPLE RESULT
04/10/2007 12:08:01 +0200 org.archive.jmx.Client PeakUsage:
committed: 268435456
init: 268435456
max: 268435456
used: 214605320
And a rather stupid script to convert the output into .csv format:
#!/usr/bin/perl -w
my $file="permspace.log";
my ($date,$commited,$init,$max,$used,$newline)="";
open(TMP,$file)|| die "No file to open $file";
while($date=<TMP>){
	$commited=<TMP>;
	$init=<TMP>;
	$max=<TMP>;
	$used=<TMP>;
	$newline=<TMP>;
	my @temp=split(/ \+/,$date);
	my @temp2=split(/: /,$used);
	print "\"$temp[0]\",$temp2[1]";
}
close(TMP);
No doubt, it takes time to know which beans are relevant. I would suggest using jconsole.