...
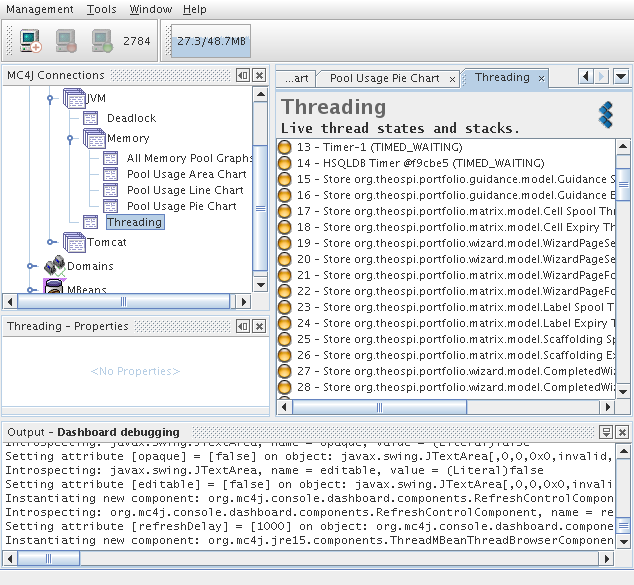
The tool even has a nice deadlocking interface
Sakai runs on a JVM and a Tomcat server which contain much management information. The management information has potential to be highly useful for long term profiling or regular system administration. Once the administrator enables remote viewing via a few JAVA_OPTS values it is possible to directly query the information from the command line via an Open Source project:
http://crawler.archive.org/cmdline-jmxclient/index.html
To search for all managed information locally on port 3333:
| Code Block |
|---|
java -jar cmdline-jmxclient-0.10.3.jar - localhost:3333
|
Note: the - sign states that no user name or password are required.
The returned listing mentions around 1215 managed beans with potentially relevant information.
To zoom in on one managed bean:
| Code Block |
|---|
java -jar cmdline-jmxclient-0.10.3.jar - localhost:3333 "java.lang:name=CMS Perm Gen,type=MemoryPool"
|
to search for Permanent space usage:
| Code Block |
|---|
java -jar cmdline-jmxclient-0.10.3.jar - localhost:3333 "java.lang:name=CMS Perm Gen,type=MemoryPool" PeakUsage
|
No doubt, it takes time to know which beans are relevant. I would suggest using jconsole to browse through the beans.
