Visualization
Introduction
Based on:
- Initial manipulation of commit data by Charles Severance
- The commit logs since the start and Findbugs report from 20 January 2009 pulled out of .externals
- Static code analysis
I have converted raw data into TM3 format (find attached) which you can review via Jtreemap
(http://jtreemap.sourceforge.net/). To run, download, unpackage and then click on /docs/jtreemap.jnlp
Process Change
- A few organisations and individuals commit a lot (figure 1, figure 2) therefore focussed peer reviews of the top ten- twenty individuals will help find bad habits and quickly improve forward going quality.
- I would also suggest peer reviews of the largest bug density projects as shown in figure 4.
- As we go on the Kernel should have a very low bug density and at present, it is mid ranking.
- Samigo may have an Internationalization issue.
- There are a lot more conclusions that one can make with the data through different visualisations and statistics.
Screengrabs plus comments
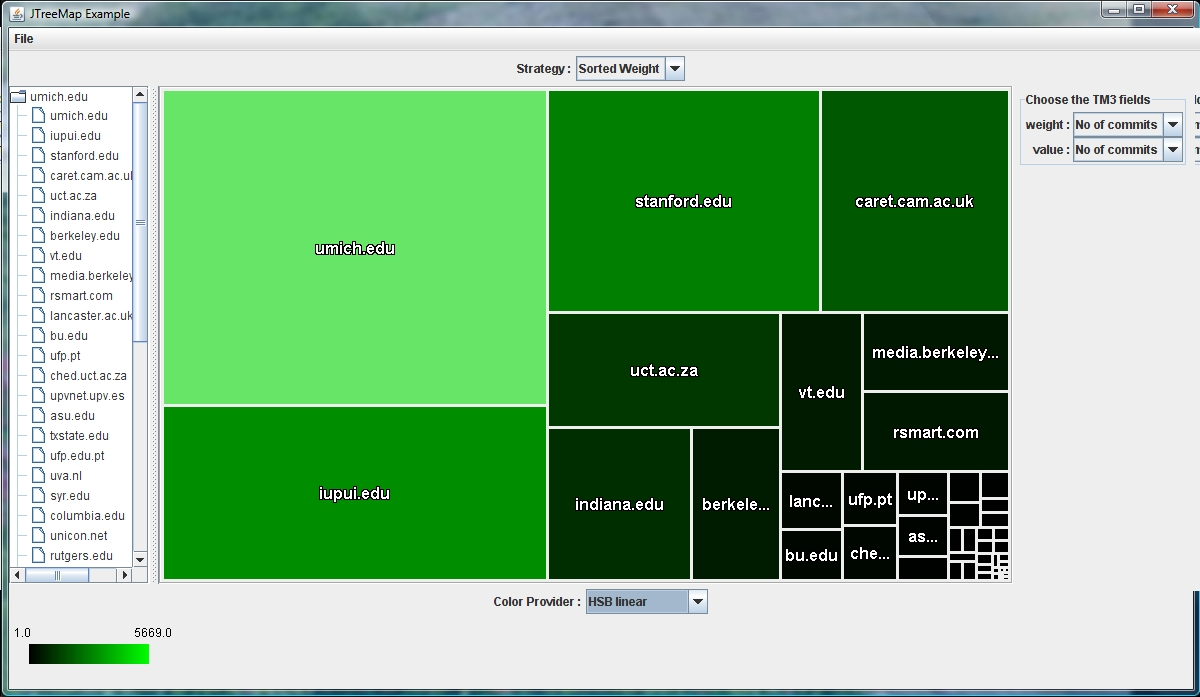
Figure 1: Email domains per Project
Some teams are much more busy than others
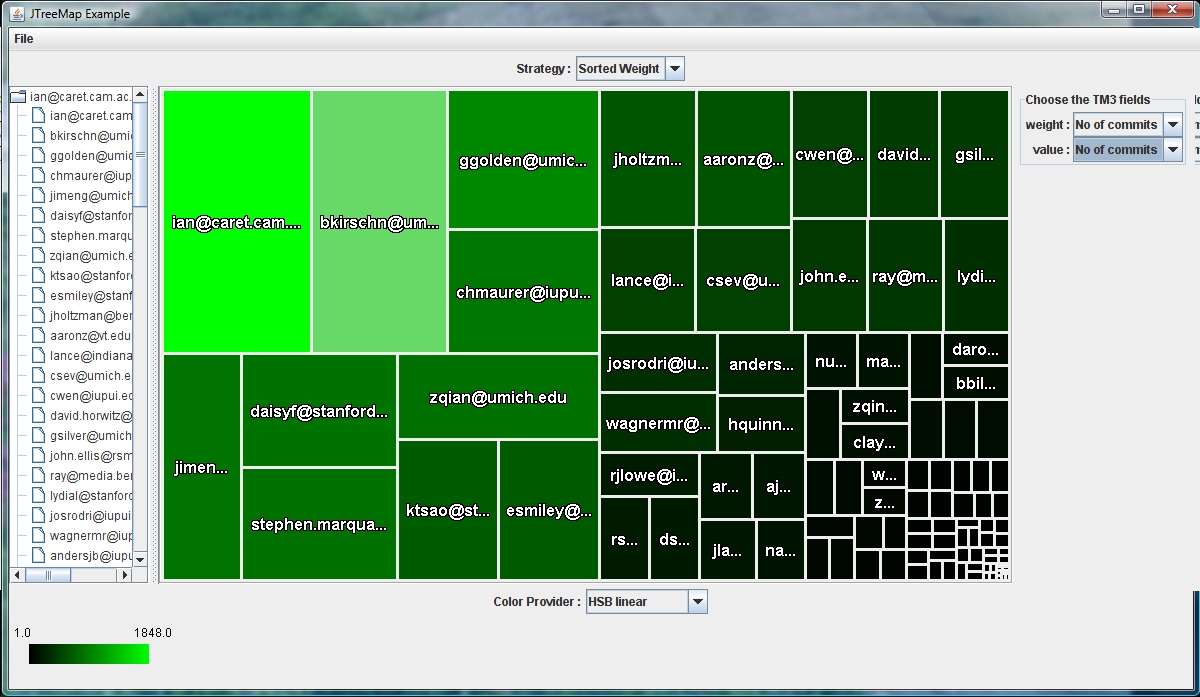
Figure 2: Commit activity per
Some individuals are much more busy than others
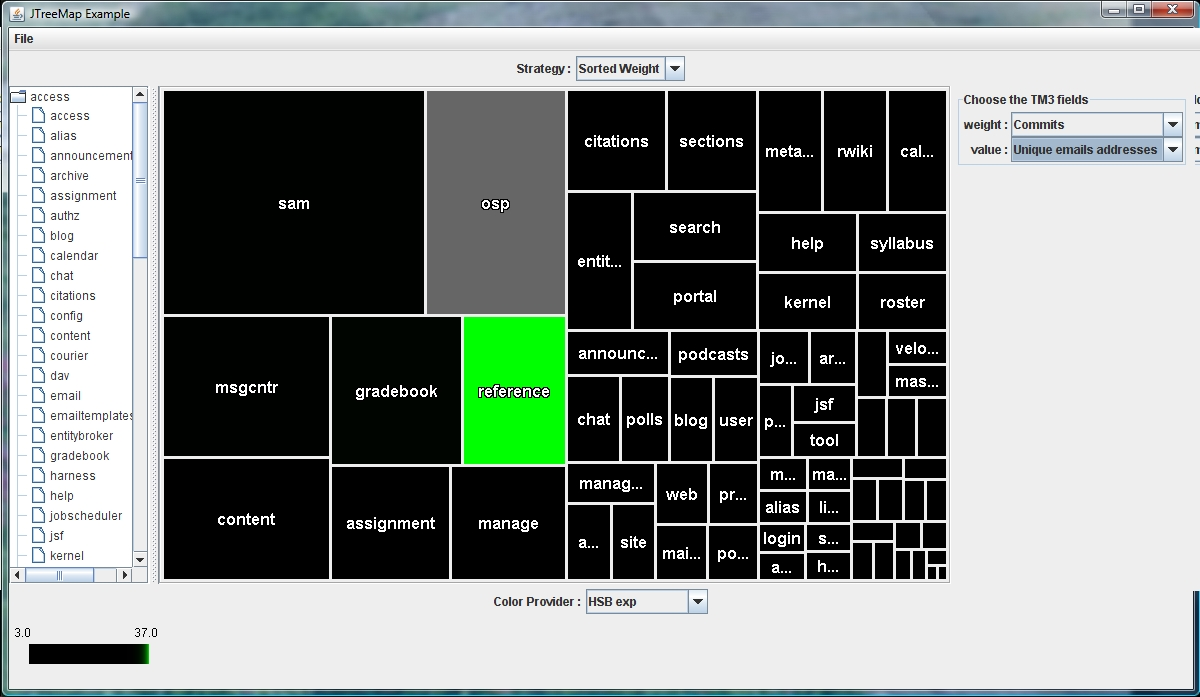
Figure 3: No unique email addresses vs project
Nice to see that documentation was worked on by the largest group.
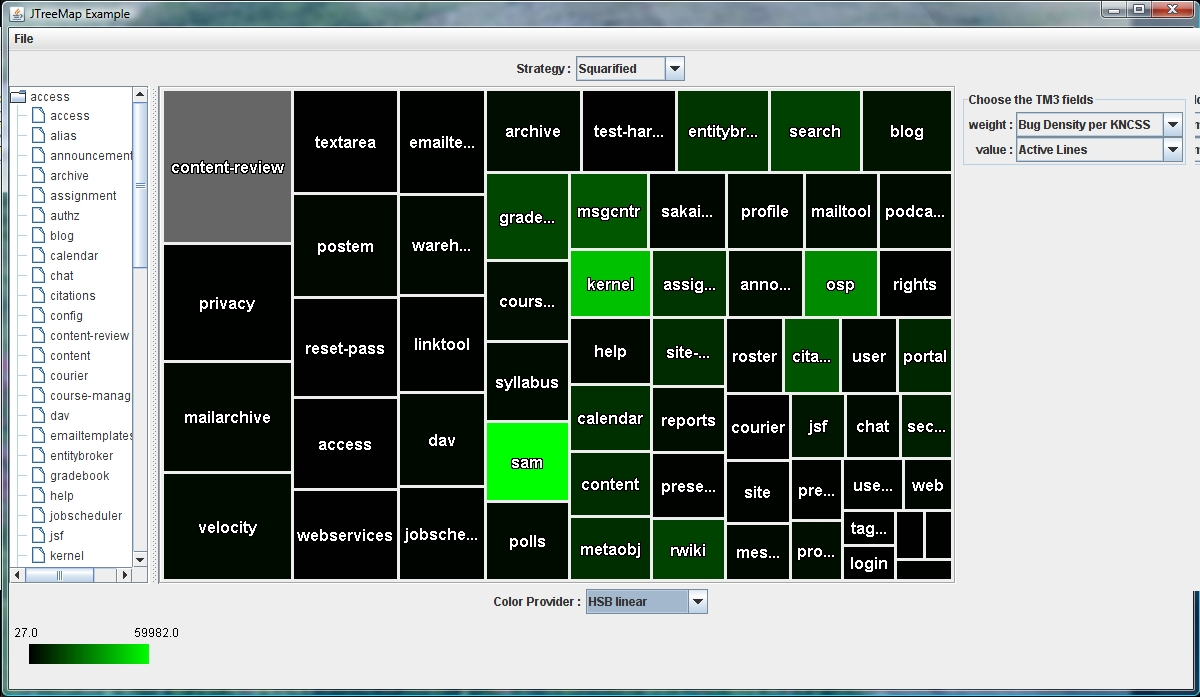
Figure 4: Bug density vs Total number lines of code
Though samigo, kernel have medium level bug density because of the the code size they have a significant total number of percieved defects.
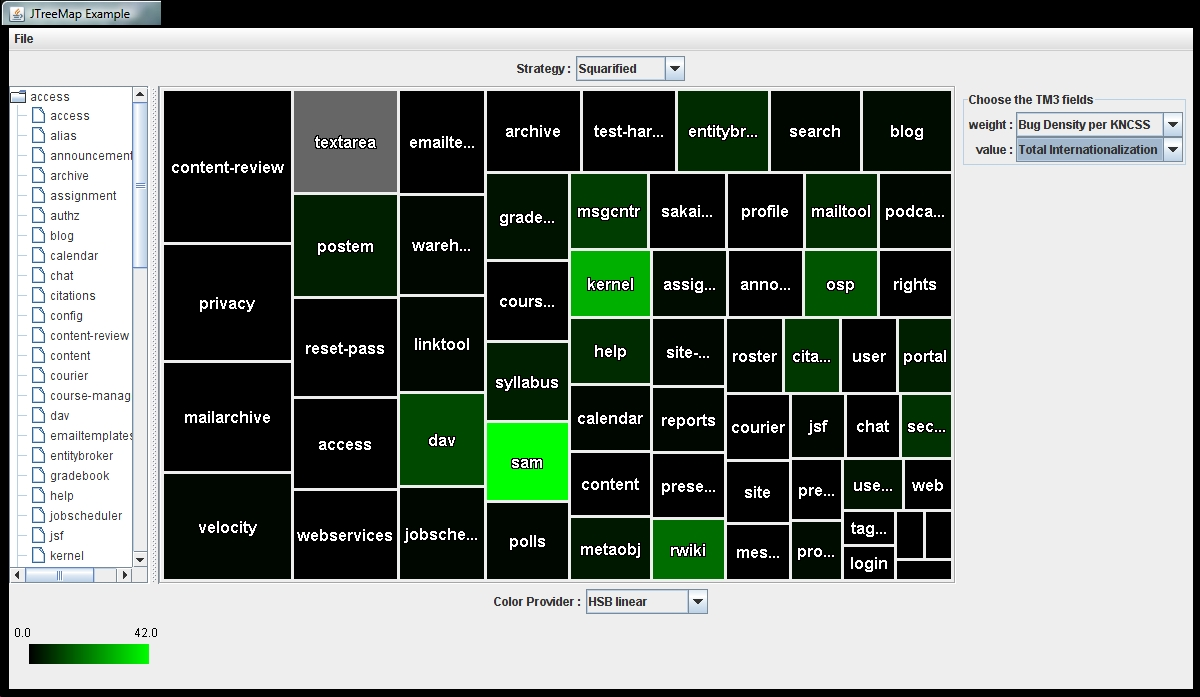
Figure 5: Bug density vs Total Internationalization bugs per project
Samigo may have an issue with accented characters (especially in Turkish).
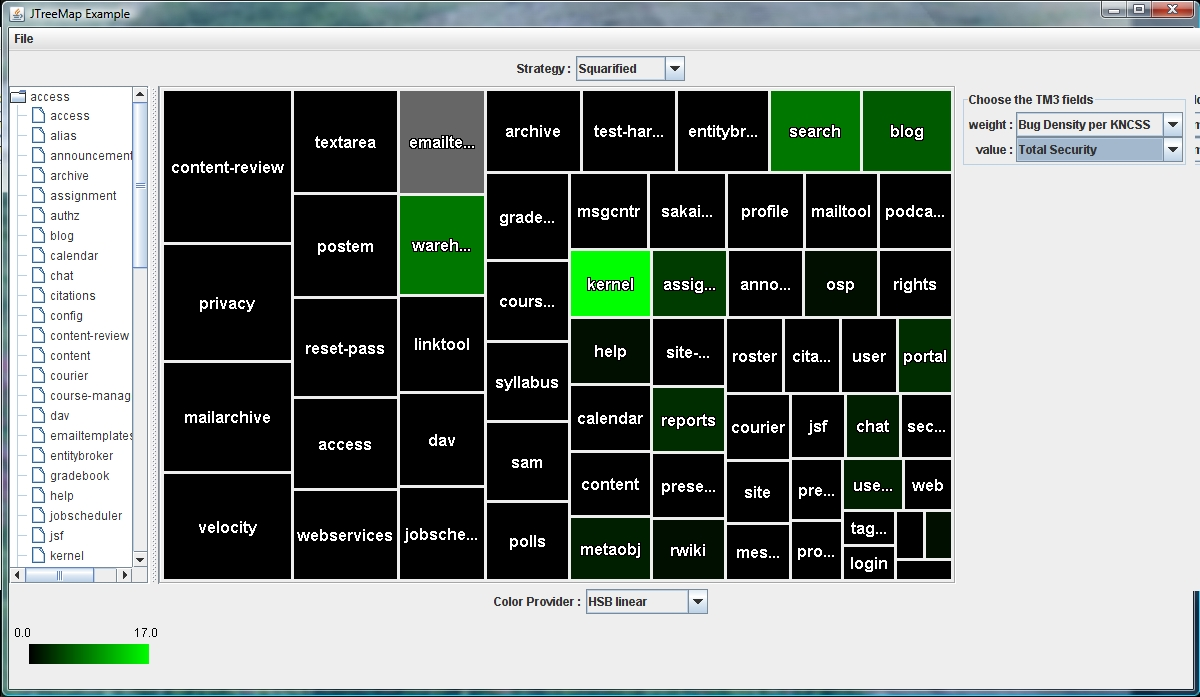
Figure 6: Bug density vs Total security related bugs per project
OK, we need to verify if the security bug patterns are relevant and if so remove them from the Kernel
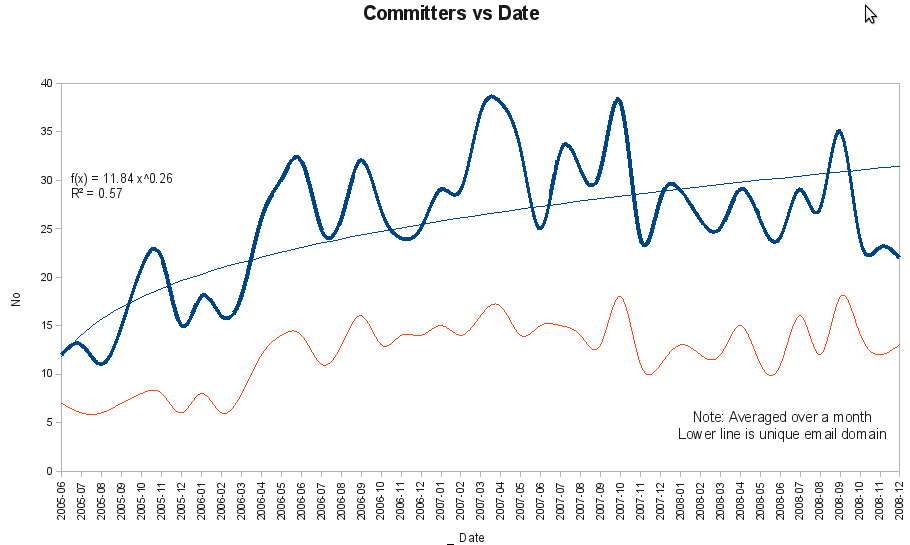
Figure 7: Committers vs date
Ok, so the growth in number of committers may of topped off in 2007
Figure 8: Animated gif (1 sec delay)time series of Email domain for first 19 months.
I consider this a failed test of using animated gifs.
Notice that there is an archive file as an attachment that breaks down treemaps per month.
Figure 8: Animated gif (2 sec delay) Commits per person summed over a given month.
Figure 9: Total commits per email domain
Figure 9: Animated Gif (2 sec delay) Commits per email domain summed over a given month