Report details
Introduction
A prototype Sakai tool was built to highlight the value of Automatic code reviews. The meaning of the generated report and the tool itself and surrounding content are described.
After reading the Walk through for the example report generation, without reseting the session generate a report for the sakai-login-tool. You may now download the report
For example if you have wget installed on your machine then download via:
wget -r http://qa1-nl.sakaiproject.org:82/coverage/sakai-login-tool/index.html
Notice that you can replace the name from sakai-login-tool to that of the relevant war file in the URL.
See also: Design of helper
Report Walk thru (top down)
Top level
Summary at the Package(s) level
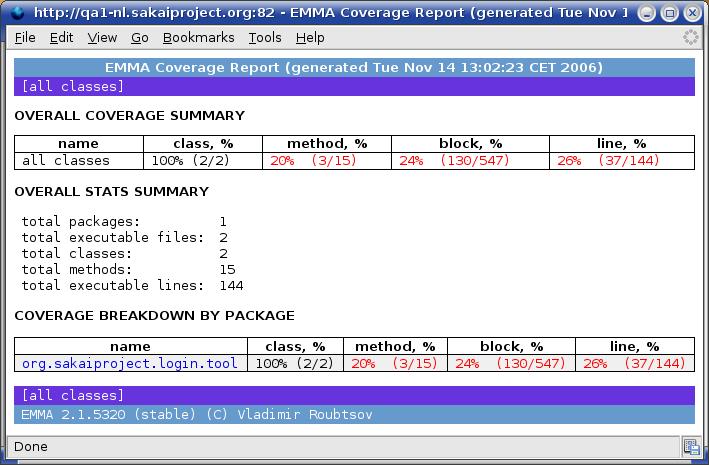
The top level report mentions coverage per class,method, block and line. Roughly speaking a block is a set of Java actions that are run as one atom, for example the code contained within a branch of an if statement.
Overall stats summary clues you in quickly to how covered the code is.
The coverage is broken down into packages.
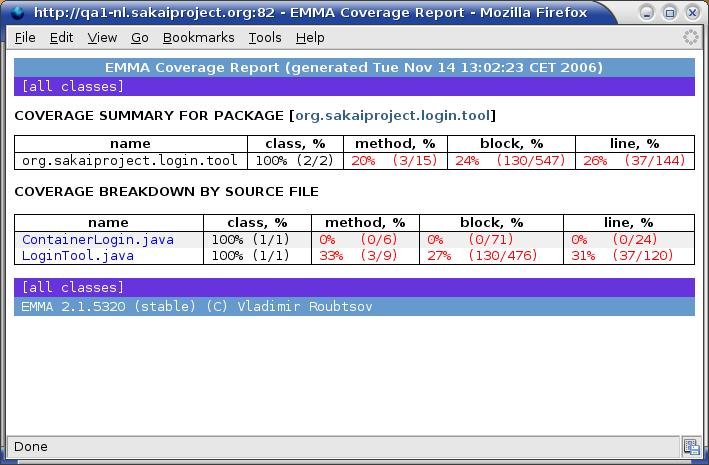
Class level
Summary at the Package level of the the classes within
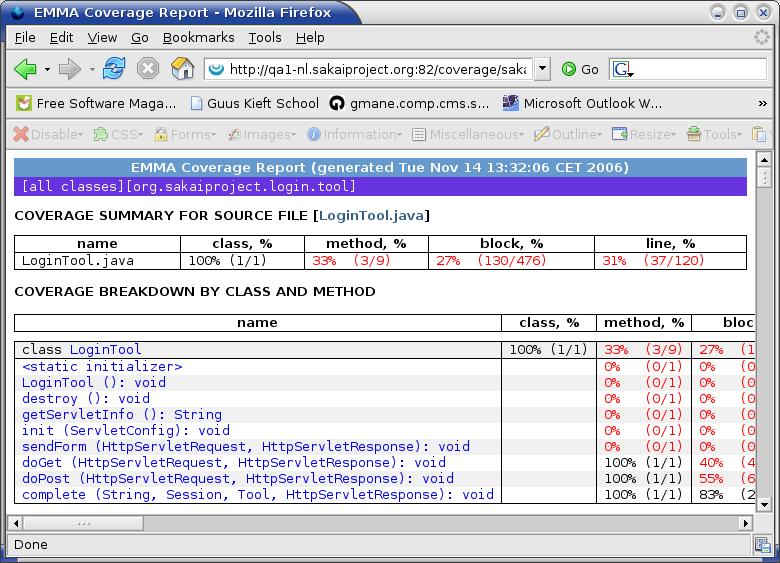
Source code level --> (a) top of report
Summary at the method level
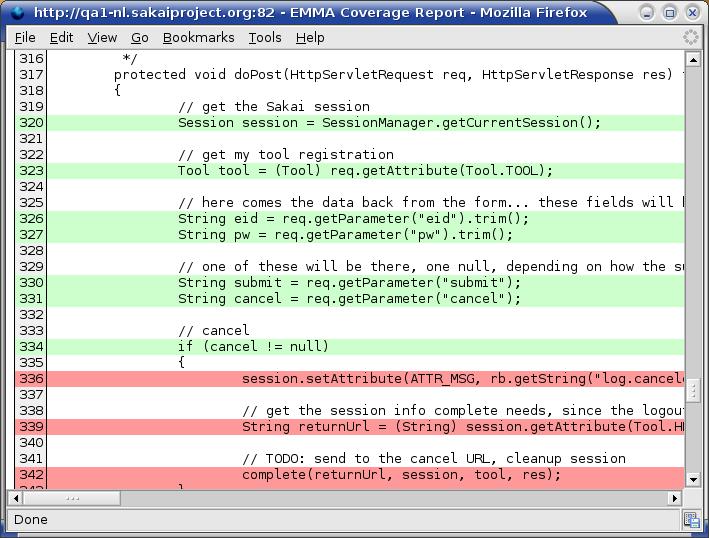
Source code level --> (b) bottom of the report
Summary at the method level (line by line explanation)
- Red = not exercised
- Green=Code that has run
- Yellow=Code that has partially run